FCAT Scores Released: A Complete Look At North Escambia Schools
June 30, 2010
Writing scores increased on the 2010 FCAT for schools in the North Escambia area, while Northview, Tate, Ernest Ward and Ransom recorded some of the highest scores in the county at some levels.
 The state decreased the grade level baseline score from 3.5 to 3.0 in writing, creating an increase of grade level students at almost every school in Escambia and Santa Rosa counties.
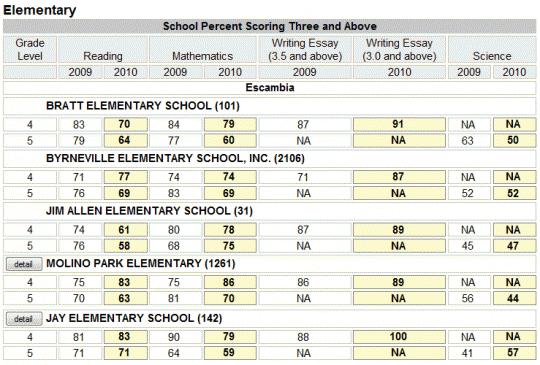
The news was not good for Bratt Elementary, with fourth and fifth grade scores falling — sometimes at the double digit level — in reading, math and science.
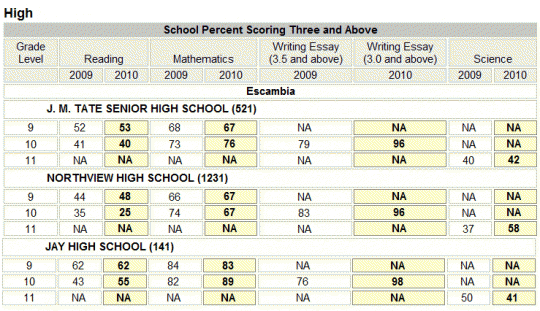
The percentage of students at Northview High School scoring at grade level or above in eleventh grade science was the highest in the county at 58 percent. Northview and Tate tied for second best in the county for the highest high school writing scores and the best ninth grade math scores. Tate had the second highest number of students in the county at grade level in tenth grade math.
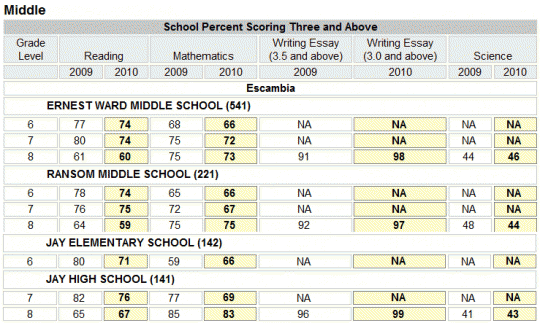
Ernest Ward and Ransom middle school sixth and seventh graders had the second highest percentage in the county at grade level in math. Ernest Ward’s writing scores were the third best in the county.
Scores for each North Escambia area school are below. At the bottom of the page, this story continues with a school by school analysis.
School by school analysis
Writing scores improved at every grade level taking the test at every school the North Escambia area.
Bratt Elementary’s scores decreased in a year by as much as 17 percentage points across the board in reading, math and science.
At Byrneville Elementary, there were decreases in fifth grade reading and math, and gain in fourth grade reading. Fourth grade math and fifth grade science scores were consistent from 2009 to 2010.
Jim Allen Elementary’s scores decreased from 2009 in fourth and fifth grade reading and fourth grade math. Scores improved in fifth grade math and science.
Jay Elementary’s scores decreased in fourth and fifth grade math, and improved or held steady in fourth and fifth grade reading and science.
Ernest Ward Middle’s scores decreased in reading and math at all grade levels and increased in eighth grade science. At Ransom Middle, scores over the past year decreased at all grade levels in reading, seventh grade math and eighth grade science. There was a slight increase in the school’s sixth grade math. At the 6-8 grade levels at Jay, there were decreases at all levels in reading and seventh and eighth grade math. Jay’s scores improved in eighth grade science and math.
Northview High’s scores over the past year fell in tenth grade reading and math and increased in ninth grade reading and math, and eleventh grade science. At Tate High, scores over the past year fell in ninth grade math and tenth grade reading. Tate’s scores increased in ninth grade reading, tenth grade math and eleventh grade science. At Jay High, there were decreases in ninth grade math and eleventh grade science. Jay’s scores increased or held steady in ninth and tenth grade reading and tenth grade math.
Comments
22 Responses to “FCAT Scores Released: A Complete Look At North Escambia Schools”


My daughter was in 6 grade last year. I don’t understand how she can make good grades all year long and score so low on both math and reading Fcat scores. I don’t like tests given at the end of the school year that determine if a student should be in special reading or math classes the next year. Double block reading and doubleblock math for 7 grade. I’m so glad I didn’t have to deal with it when I was in school. It’s very discouraging.
I am a transplant to the Century area. The first couple of years my child went to private school. He now attends Ernest Ward. I think some of these comments are prime examples of how one group of people can not be stereotyped.
Shaun – I am totally with you. Maybe people should spend less time being judgemental and more time trying to be a mentor or outstanding influence in the community.
Well said, educator. Thanks for the clarification.
If you look at any set of students who had to consolidate from two separate schools to one school, you would see a change in test scores. That was hard on the children from Bratt and Century. In the long run, it will be good for the children but they need time to adjust to such a big change. The last thing kids need to hear is adults blaming them for “ruining” a score. They are children — and what we really need to hear us say to them is this: “We have some work to do, all of us”. Let me come to your school and volunteer as a mentor. Let me give your teacher some supplies for you to use. Here are some really great books and math games for your classroom. The kids need to know we support!
No surprise about Bratt. How many children were new tp Bratt last year?
REGARDING:
” . . . still the exams will continue to be “high-stakes” tests with lots of negative consequences. . . .”
Of course a test SHOULD have negative consequences as well as positive ones.
“Do you know how to defuse the bomb correctly?”
“I’m pretty sure I do.”
Negative consequences if fail. Don’t stop until you’re sure.
As long as a test properly measures what you want to know, it’s a good thing. Those who say, “These are children, not numbers,” miss the point that the numbers give information about those children and how better to help them.
I’ve told stressed-out kids, “Ah, don’t worry about the FCAT; if you flunk it, they’ll let you take it again.”
[remember Rodney Dangerfield in Back to School when he said he loved teachers because if you did it wrong they made you do it over until you got it right.?]
“But I don’t WANT to take it again.!”
“Then just listen to your teachers and do your work and you’ll do fine.”
“My Mommy told me the FCAT isn’t fair.”
“She’s probably right, but life isn’t fair. So that might make it a good test after all.”
Then some of the smarter kids say, “Shoot, the FCAT you’re taking was easy when I took it last year.” And some of the slower kids say, “Not for me it wasn’t!”
Not all together true, though. My wife’s ESE kids did better on math than many of the non-ESE kids. Of course there’s many reasons to be ESE, though. Still, most of them would be expected to tend to yield lower performance.
David for perfect tests
perfect students
perfect teachers
perfect parents
RE: fcat
“Well, I believe students who move around mid year have their scores counted at the last of school of residence during the FTE (a census taken in schools in Fall and Spring)”
Actually, scores of students who are not “matched,” or enrolled at different schools during both October and February FTE counts are NOT figured into school grading results at either school.
David Huie, in the near future, entrance and end-of-course exams will take the place of FCAT. The first versions of these were used in 6th grade science and Algebra this year. The State of Florida is having to face the fact that the FCAT costs way too much money to continue. A move in the right direction, but still the exams will continue to be “high-stakes” tests with lots of negative consequences.
To those who are making negative statements blaming drops in test scores on particular groups of students…2 things to consider. First, and probably most important; the students and parents to whom you refer read your unkind and hurtful comments. What if the shoe were on the other foot? Second, how do you know which particular students did not do well on the exam? You can’t look at one piece of data and make a blanket statement about a whole group of students. The thing to remember is that there is a child behind the test score.
I am so proud of all of the students at MPES. Thank you for working so hard. We had a great year:)
Well, I believe students who move around mid year have their scores counted at the last of school of residence during the FTE (a census taken in schools in Fall and Spring)
These numbers are also divided in subgroups for comparison as well. ESE, gifted, low socioeconomic status (income) and other subgroups are looked at closely by schools. So they are looking at this data to see if there is a group that does or does not make more progress.
As far as comparison, the development scaled score is a more accurate description of progress than levels 1-6. School are looking for a gain of roughly 100-150 points to call it annual yearly progress. So a kid can make a learning gain and stay within a level.
I think it’s just crazy to put so much at stake for a single test given one week out of a school year. I would hate for my employer to evaluate my performance on one one week out of the year. What if I don’t feel good or I have a personal problem at home?
I agree with Shaun. Instead of complaining about the test scores, volunteer at the school. Also, we don’t know what each individual child made on the FCAT so please don’t point blame on children. We should remember they are still children and adults should always model appropriate behavior.
I for one am sick and tired of reading all the slams against Century Kids. Whether they are white or black, male or female, really bright or not as fortunate; they are still a child that cant control what the school district decided to do. If all of you highfalutin people that enjoy making the negative comments about the Century kids would get off your white horse and maybe volunteer to do some tutoring to help them out, you would see a differnce in your results next year.
I would love to know the attendance rate in these high schools. And I’m talking about attendance based on students sitting in regular classrooms each day, not including those in in-school suspension or in-school expulsion. Teachers and students have a chance to achieve learning gains if students at least show up and behave. Even if these students are unmotivated to begin with, a teacher has a chance to interest them. But if these students are at home or out of their classrooms, much is lost. Poor attendance and lack of parental participation, sometimes caused by poverty not attended to, wrecks student learning. What is poor attendance? Certainly more than 3 absences per semester.
No Surpise, I guess you can blame the decrease in Jay High School on the kids
for Century also.
GREAT IDEA bringing Century kids to Bratt and Ernest Ward! NOT!
It,s bad to see the Bratt scores tumble after being in the top percentile last year. I think it was predicted this would happen a year ago.
Congratulations MPES ! Iknow everyone really worked hard and the scores show it. Thanks to all the great teachers at MPES. Good job students, you made your teachers and family proud.
On the FLDOE website, the state reports the average development scale score changes for groups of students at various schools.
This data reflects a more accurate account of what teachers and students were able to accomplish from one year to the next.
For example, the report may show that the 2009 DSS average for a group of 7th graders was 1776 and the 2010 DSS average for this same group of students is 1886. This would prove that the students improved scores drastically. Then, the DSS change could be compared to that of other schools or grades.
As a teacher, I look at the percent proficiency of the students that I teach when they arrive in my class at the beginning of the year, and compare it to the new percent proficiency. I also look at the percentage of students making learning gains, which will be on a FLDOE report soon.
Yep, properly you would think you would have the same test at beginning and ending and compare changes for each individual student from wherever and then present the percentages per school.
It just isn’t done.
On each grade level they test based on what they think the kids should know there, not on what they changed in knowledge from last year.
A kid might move into or out of a school just before the test and it would skew the results.
The people charged with grading the students might be incompetents at it, either not knowing their jobs or expecting what was not required.
Still, it makes interesting reading. If there weren’t too many changes in placement, it might give an idea of how a school is doing. Regardless, it gives an idea of how the children at that school are doing.
For instance, 42 percent of the fifth grade students at Jim Allen don’t read as well as would be expected. 25% of them can’t do math as well as would be expected. 53% of them don’t understand science as well as would be expected.
That’s interesting, no matter how it happened. Are we expecting too much from them? Are we expecting too little from them? Are we checking them properly?
Is there a solution? Lots of folks think it is all the teacher’s fault for any failings and praise for any gains. I’ll bet you a nickel, you could switch teachers from the best performing schools with the teachers from the worst performing schools and the best won’t instantly crash nor the worst instantly soar.
David wondering how our legislators would perform
Thanks Century, I knew you guys would help.
I don’t think we can compare the scores from 4th grade in the previous year to the scores from the current year’s 5th graders either. Even though some of the students may be the same, it is two totally different tests. The test has different content and uses different styles of questioning. Likewise, you shouldn’t compare the scores from last year’s 3rd grade to this year’s 4th grade scores. It’s just too different of a test.
If we compare the 4th grade scores from 2009 to 5th grade scores from 2010, then all elementary schools listed above (Bratt, Byrneville, Jim Allen, Molino Park, and Jay) would have all decreased in reading and math.
I do, however, agree that we can spend all day twisting these numbers. I also agree that the state tends to forget that there are kids behind these numbers.
Apples and Oranges anyone wrote:
I don’t disagree, but grade-to-grade is even the way the state chooses to make comparisons in their own press releases.
You can almost see the comparison group of kids to group of kids by looking at the data above, and you’ll see that sometimes it does change an “increase” or “decrease”.
Just to pick the first example I noticed, the story says there was an increase in fourth grade reading at Byrneville Elementary and a steady score in fourth grade math. But if you compare the fifth grade 2010 scores to presumably most of the same children in fourth grade in 2009, there were decreases in both reading and math.
Same group of student comparisons from year to year have problems — how many of this year’s fifth graders at Molino Park, for example, did not attend Molino Park in the fourth grade? With our North Escambia schools, probably most did. But at say Blue Angel where there is a lot of military, those percentages would be a lot different.
And from the general data provided by the state, how would you track students from middle to high school? You can’t determine how many students in ninth grade were from a “feeder” school in eighth grade. And what about a magnet school like West Florida?
There are just so many ways to look at (OK, I’ll say it — twist) the numbers, and the state is so terribly good at twisting them sometime I think they forget about the kids behind the numbers.
Congrats to E.W.M. school 8th. grade writing scores!!! WOW 98 !!!!!!!!!!!!!!!!
I think it is so wrong to look at the data from 2009 and 2010 and compare the two. It is a totally different group of students. It’s not like it is a pre and post test with the same group of kids. Maybe you should post the district averages so everyone can see how the northend schools compare to the district as a whole.